How to Master Freelance Data Visualization to Attract High-Paying Clients in 2025

Introduction: Freelance Data Visualization Is Your Secret Sales Weapon
In today’s freelance world, especially in 2025, big claims don’t impress serious decision-makers. Saying you have a “great attitude” or “creative spark” simply doesn’t cut it. What they want to see is evidence — and that means visualizing data in a way that clearly communicates impact and results. And that’s where performance data comes in — numbers that clearly show the value you bring, transformed into visual stories that resonate.
If you’re new to this approach, our ultimate guide to freelance data analytics walks you through how to collect, interpret, and prepare the metrics that matter before turning them into compelling visuals.
Independent professionals who actively track and showcase their results through effective freelance data visualization consistently win higher-value opportunities than those who rely on portfolios alone, especially in today’s competitive remote work environment. When you present concrete numbers—whether it’s a 45% increase in website traffic visualized in an interactive dashboard, a 23% boost in conversion rates shown through before-and-after charts, or consistently meeting deadlines 98% of the time displayed in a performance timeline—your visual data analysis transforms you from another service provider into a strategic partner.
This comprehensive guide reveals how to leverage freelance data visualization as a powerful tool for winning high-value projects. You’ll learn which metrics matter most, how to present them visually, and why data-driven professionals who excel at visualization command premium rates in today’s freelance market.
Why High-Paying Clients Trust Freelance Power BI Consultants in 2025
The Trust Factor Revolution
High-value decision-makers aren’t looking for the cheapest option — they want reliable partners who think strategically and can deliver consistent, measurable outcomes. That’s why data-savvy freelancers focus on decision-making impact — as outlined in our guide on how freelance data analysts make smarter business decisions in 2025. That’s exactly why freelance Power BI consultants have become increasingly sought-after among premium buyers. The data you track and visualize becomes your foundation of trust, showing you’re more than just a creative — you’re a results-focused partner who can transform raw numbers into actionable insights:
ROI Demonstration Through Visual Dashboards: Numbers speak louder than testimonials, especially when presented by a skilled freelance Power BI consultant. A decision-maker who sees an interactive dashboard showing that you increased their competitor’s email open rates by 34% immediately understands your value proposition.
Risk Mitigation: Hiring independent professionals involves inherent risk. Concrete evidence presented through professional freelance data visualization reduces this uncertainty by demonstrating your capabilities and dependability in a format that’s easy to digest. However, many freelancers unknowingly sabotage their impact by misusing or misinterpreting data — here are the top 10 data-driven decision-making mistakes freelancers must avoid in 2025.
Professional Positioning: Data-driven visual presentations separate you from less experienced independents. You’re positioning yourself as a strategic consultant — someone who delivers results with the precision often expected in the corporate world, but with the agility and focus of an independent professional skilled in modern visualization tools.
Decision-Making Speed: Executives make faster decisions when presented with clear, visual insights. Your skill in freelance data visualization and presenting clear, data-driven dashboards speeds up their decision-making process significantly.
The 2025 Shift in Professional Expectations
Modern decision-makers expect the mindset of a visual data analyst — someone skilled in interpreting data and applying business intelligence to extract actionable insights through compelling visualizations.
In 2025, going solo means more than just working independently — it means taking ownership of your results, thinking like a freelance Power BI consultant, and proving your value through measurable outcomes presented in visually engaging formats.
Today, visual data insight is no longer optional; it’s a core expectation. Organizations that hire data visualization professionals are looking for partners who understand key metrics, monitor performance, and clearly articulate how their work contributes to broader business goals through compelling visual insights.
↑ Back to Table of ContentsData Storytelling Examples Freelancers Use to Win Premium Projects
To make a real impact with your freelance data visualization, you need to master the art of narrative. Here are powerful data storytelling examples that high-paying prospects genuinely care about:
Project Impact Through Visual Narratives
These data storytelling examples show direct results tied to business performance and are often the most persuasive when visualized properly:
Traffic Growth Visualization – Create compelling bar charts showing website visits, page views, unique users, and session time to highlight trends clearly. A skilled practitioner of freelance data visualization shows these as percentage gains over clear timeframes using trend lines and heat maps.
Conversion Funnel Stories – Click-throughs, form submissions, sales conversions, and leads generated tell a powerful story when visualized as a funnel. These data storytelling examples have a direct link to revenue and are highly effective.
Engagement Timeline Narratives – Email open rates, social shares, comments, and interactions tell a story of growing audience interest when presented as an interactive timeline — a specialty of experienced freelance Power BI consultants.
Revenue Impact Dashboards – Sales attribution, lower acquisition costs, or increased customer lifetime value visualized in executive dashboards — these are priorities often emphasized by top-tier buyers seeking freelance data visualization expertise.
↑ Back to Table of ContentsData-Driven Storytelling Examples from Real Client Success
Want to see data-driven storytelling examples in action? Here’s how successful freelancers combine narrative with numbers:
Case Study: E-commerce Transformation
A freelance Power BI developer helped an online retailer visualize their customer journey data. Instead of merely reporting a 35% decrease in bounce rates, they built an interactive narrative that showed:
- The initial problem (visualized customer drop-off points)
- The intervention (A/B test results displayed in real-time)
- The outcome (revenue increase of $127,000 over 90 days)
This is one of the most effective data-driven storytelling examples because it combines emotional narrative with hard numbers, all presented through professional freelance data visualization.
Case Study: SaaS Growth Story
Another powerful example comes from a freelancer who specialized in telling a story with data for a software startup. They didn’t just say “trial conversions improved” — they created a visual narrative based on a real dataset, showing:
- Week-by-week conversion rate improvements
- Customer feedback sentiment analysis
- Revenue projections based on current trends
These data-driven storytelling examples demonstrate how combining narrative structure with visual data creates compelling evidence of your value.
↑ Back to Table of ContentsHow to Get Hired for Data Visualization Jobs: Build a Specialized Portfolio
The market for freelance data visualization jobs is expanding rapidly. To capture these opportunities, your portfolio needs to demonstrate both technical skill and storytelling ability. Here’s how top freelancers structure their visual portfolios:

Interactive Case Studies
Don’t just showcase static images — create interactive experiences that let potential clients explore your freelance work through impactful data visualization projects. Include:
- Clickable dashboards showing real client results
- Before-and-after comparisons with sliding controls
- Embedded Power BI reports (if you’re positioning as a freelance Power BI developer)
Industry-Specific Visualizations
Target freelance data visualization jobs by creating sample dashboards for specific industry use cases:
- Healthcare: Patient outcome improvements
- E-commerce: Conversion funnel optimization
- SaaS: User engagement and retention metrics
- Finance: ROI and portfolio performance
Storytelling with Data Examples That Convert Prospects
The best storytelling with data examples follow a clear narrative structure while maintaining visual impact — always grounded in the accuracy of the underlying data. Here’s how to create them:
The Three-Act Structure for Data Stories
Act 1: The Challenge – Visualize the problem using freelance data visualization techniques. Show declining metrics, missed opportunities, or competitive gaps through compelling charts.
Act 2: The Journey – Use progressive disclosure in your visualizations. As a freelance Power BI developer would do, guide viewers through your process with interactive elements that reveal insights step by step.
Act 3: The Resolution – Showcase the transformation with powerful before-and-after visualizations. These storytelling with data examples should make the impact immediately clear and emotionally resonant.
↑ Back to Table of ContentsHow to Position Yourself as a Freelance Power BI Developer
The demand for skilled freelance Power BI developers continues to surge. Here’s how to position yourself effectively:
Technical Showcase Strategies
- Create a dedicated section highlighting your Power BI expertise
- Include screenshots of complex DAX formulas you’ve written
- Show custom visualizations you’ve developed
- Demonstrate your ability to connect multiple data sources and work with complex data sets across platforms
Business Value Communication
Being a successful freelance Power BI developer means translating technical capabilities into business outcomes:
- “Reduced report generation time from an hourly process (5 hours) to just 15 minutes”
- “Enabled real-time decision making for C-suite executives”
- “Consolidated 12 separate Excel reports into one interactive dashboard.”
Freelance Business Intelligence: Expanding Your Service Offering
Positioning yourself in the broader freelance business intelligence market opens doors to higher-value projects. Here’s how to expand beyond basic reporting:
Strategic BI Services
Freelance business intelligence professionals offer more than just dashboards:
- Data strategy consulting
- KPI definition and measurement frameworks
- Predictive analytics implementation
- Data governance recommendations
Packaging Your BI Expertise
Create service packages that showcase your freelance business intelligence capabilities:
- Starter Package: Basic dashboard creation and monthly reporting
- Growth Package: Advanced analytics with predictive modeling
- Enterprise Package: Full BI implementation with training and support
Data Storytelling Template for Consistent Client Wins
Having a reliable data storytelling template ensures you can quickly create compelling narratives for any client. Here’s a proven framework:
The IMPACT Template
Identify the key metric or problem. Map the data journey visually, Present insights progressively, Anchor with emotional resonance, Call to action with projected outcomes, Tie back to business objectives.
This data storytelling template works across industries and can be adapted for any freelance data visualization project.
Customizing Your Template
While having a data storytelling template provides structure, customization is key:
- Adjust color schemes to match client branding
- Modify chart types based on data complexity
- Scale detail level to audience expertise
- Include industry-specific benchmarks
Telling a Story with Data: Advanced Techniques
Master the art of telling a story with data by incorporating these advanced techniques into your freelance data visualization practice:
Emotional Anchoring
Numbers alone don’t persuade — emotion does. When telling a story with data, connect metrics to human outcomes:
- “This 23% reduction in load time meant 5,000 customers didn’t abandon their carts”
- “The 15% efficiency gain gave the team back 2 hours daily for strategic work”
Progressive Revelation
Expert practitioners of telling a story with data don’t overwhelm viewers with cluttered charts and graphs. Instead, they:
- Start with the big picture
- Zoom into specific insights
- Build understanding layer by layer
- End with actionable recommendations
Freelance BI Developer: Technical Skills That Command Premium Rates
As a freelance BI developer, certain technical skills significantly increase your market value:
High-Demand Technical Competencies
- Data Modeling: Star schemas, snowflake schemas, and dimensional modeling
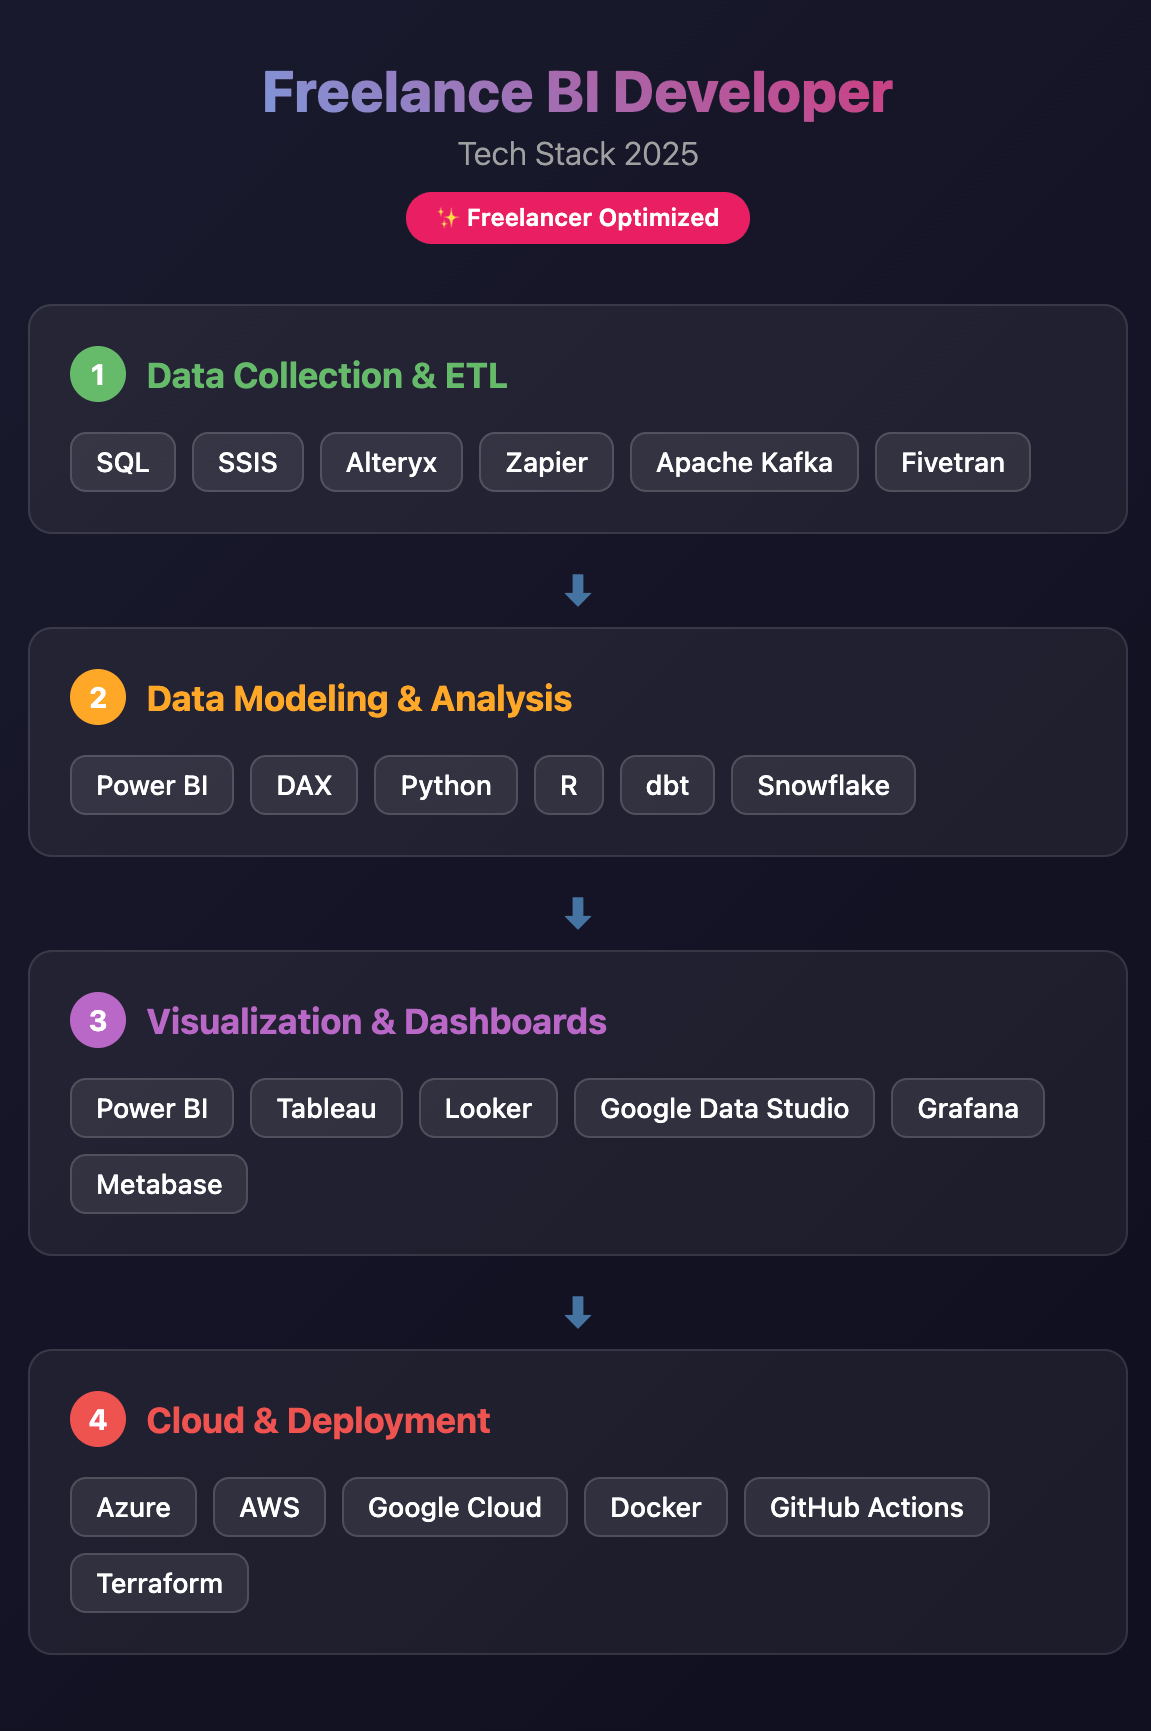
- ETL/ELT Processes: Expertise with tools like SSIS, Alteryx, or cloud-based solutions
- Advanced Analytics: Statistical analysis, machine learning integration, and predictive modeling using Python
- Cloud Platforms: Azure, AWS, or Google Cloud BI implementations designed to handle big data workflows and enterprise-scale analytics
These high-demand skills enable you to meet complex client visualization needs — from building custom dashboards to scaling real-time data pipelines.
Soft Skills for BI Success
Being a successful freelance BI developer requires more than technical prowess:
- Translating complex data concepts for non-technical stakeholders
- Managing stakeholder expectations during long implementations
- Training end-users to become self-sufficient
- Documenting solutions for long-term maintenance
FAQ: How to Use Freelance Data Visualization to Attract High-Paying Clients
1. Which Performance Metrics Matter Most to Premium Project Owners?
It’s simple: they care about what moves the needle for their business. That means things like higher conversion rates (more signups, purchases, or leads), revenue growth, or cutting costs and speeding up delivery. As a freelance Power BI consultant, you’ll want to visualize these metrics in ways that make the impact immediately clear.
If you’re unsure which metrics matter most or how to track them, our comprehensive guide to freelance data analytics walks you through the process of identifying and applying KPIs that attract premium clients.
They also look for signs you’re reliable, like finishing projects on time (95%+ is a strong benchmark) or working with repeat partners.
Forget vanity metrics. A 15% bump in conversions shown through effective freelance data visualization is way more convincing than saying you’ve got 10,000 Instagram followers.
2. How can I highlight measurable results in presentations as an independent professional?
Keep it simple and prospect-focused. Don’t just show what you did — use freelance data visualization to show what changed because of your work.
For every project, add a quick visual “Results” snapshot. That could be:
- “+26% email open rates in 4 weeks” (shown as a trend line)
- “Saved 12 hours/month by automating data processes” (displayed as a time savings chart)
- Want to do the same? Learn how to set up automation that tracks and delivers your key metrics without manual effort in our guide to freelance data automation.
- “Generated 140 new leads with a $150 ad spend” (visualized as a cost-per-lead comparison)
Even a single powerful visualization can make a difference. This is what separates successful freelance BI developers from the competition.
3. What are the best tools to present project results effectively?
For freelance data visualization jobs, these tools excel:
- Power BI: Essential if you’re positioning as a freelance Power BI developer
- Tableau: Great for complex, interactive visualizations
- Looker Studio (formerly Google Data Studio): Perfect for freelance business intelligence projects with real-time data
- Notion + Charts: Excellent for creating a data storytelling template
- D3.js: For custom, web-based interactive visualizations
Want to see how these tools can be brought together into a unified system? Explore our KPI dashboard template for freelancers to learn how to turn raw metrics into strategic dashboards that showcase real results.
Choose tools based on your technical skills and client needs — but remember, the story matters more than the tool.
4. How can I apply performance metrics in cold outreach to generate new opportunities?
Lead with a compelling visualization insight in your subject line (“Increased SaaS conversions by 34% [Visual Report Inside]”). In the email body, include a mini example of telling a story with data: “Based on your traffic of X visitors, here’s what a similar improvement could look like [insert simple chart].” Keep it concise—just 3–4 sentences, centered on one powerful visual insight. This approach has helped many land lucrative freelance data visualization jobs.
5. What’s the difference between vanity statistics and valuable data in visualization?
Vanity statistics look impressive but don’t connect to business outcomes — think follower counts or page views without context. In freelance data visualization, what truly matters is showing data that reveals business impact: increased conversion rates, revenue per visitor, reduced acquisition costs, and higher customer lifetime value.

Ask yourself: “Does this visualization help a CEO make a decision?” The best data-driven storytelling examples always pass this test. If your Instagram post got 50,000 likes but zero sales, that’s fluff. But if it got 500 likes and brought in 10 sales at $200 each — now that’s a story worth visualizing.
↑ Back to Table of ContentsConclusion: Become a Data Visualization Expert and Transform Your Freelance Career in 2025
In today’s independent work landscape, mastering freelance data visualization isn’t a bonus — it’s essential for commanding premium rates and attracting high-value clients. Every completed project gives you more than just a finished task: it provides powerful visual stories that demonstrate your unique value.
Those who pay well expect more than promises or static reports. They look for professionals who can transform raw data into compelling visual narratives — whether you position yourself as a freelance Power BI consultant, a freelance BI developer, or a specialist in freelance business intelligence.
The path forward is clear:
- Build a portfolio filled with data-driven storytelling examples
- Develop a reliable data storytelling template for consistent results
- Showcase your expertise through compelling storytelling with data examples
- Target high-value freelance data visualization jobs with confidence
You don’t need to master everything at once. Start by adding one compelling new data visualization to your next proposal. Create one interactive dashboard for your portfolio. Tell one data story that resonates emotionally while proving value quantitatively.
Your success in freelance data visualization isn’t just about creating pretty charts — it’s about transforming numbers into narratives that inspire action and drive business results. Let your visual stories speak louder than any resume ever could.
The market for the best freelance data visualization professionals has never been stronger — those who combine technical skills with storytelling insight are in the highest demand. With these strategies and techniques, you’re ready to position yourself at the premium end of the market, where clients value expertise, pay accordingly, and return for ongoing partnerships.
Your data has a story to tell. Master the art of freelance data visualization, and let that story open doors to the high-paying clients you deserve in 2025 and beyond.
🔗 Join our FreelanceBoosters Telegram channel for weekly data-driven insights, plug-and-play dashboard templates, storytelling frameworks, and practical BI systems that help you land high-paying freelance clients through the power of visualized data.
Your visuals aren’t just pretty charts — they’re conversion engines.
Make them work harder for you.
– Tom @ Freelance Pathway
📊 Explore More from the Freelance Data Hub
Want to go deeper with your data strategy? Explore these actionable guides:
-
❌
Top 10 Data-Driven Decision-Making Mistakes for Freelancers (2025)
Fix the blind spots that quietly drain your revenue and focus. -
⏱️
Ultimate Guide to Automatic Time Tracking Software for Freelancers
Automate your time logs and uncover your true hourly rate. -
📊
KPI Dashboard Template: Turn Your Freelance Numbers Into Growth in 2025
Create visual dashboards that highlight performance and profit. -
🔍
Freelance Data Analytics 2025: Become a Freelance Data Analyst
Learn the system to track, analyze, and grow strategically. -
💡
How Freelance Data Analysts Use Data to Make Smarter Business Decisions in 2025
See how pros turn metrics into money and insight into action.