Freelance Data Analytics 2025: Become a Freelance Data Analyst

Introduction: Why Freelancers Need Data Analytics in 2025
Here’s a harsh truth: 73% of freelancers still navigate their business decisions using gut instinct alone. Meanwhile, data-driven freelancers report 30% higher income growth year-over-year. In a freelance economy worth $1.57 trillion globally — with 64 million Americans freelancing and 69% of businesses actively hiring independent contractors—demand for data analyst freelance jobs and data analyst gig work is rapidly rising. Those who master their numbers aren’t just surviving—they’re gaining a measurable edge in both client engagements and strategic decision-making.
The era of improvisation has sunset. Your competition isn’t merely logging hours anymore—they’re dissecting client lifetime value, calibrating pricing models with surgical precision, and anticipating cash flow valleys before the ground crumbles. But here’s the silver lining: you don’t need a data science degree to join their ranks. You simply need the right framework, tools, and mindset to transmute raw numbers into strategic leverage.
This guide will revolutionize how you orchestrate your freelance enterprise. Whether you’re a designer, developer, writer, consultant, or freelancing in data analytics, you’ll discover precisely which metrics deserve your attention, how to monitor them efficiently, and most critically, how to harness data for decisions that directly amplify your bottom line.
What Is Freelance Data Analysis and How It Works in 2025
Think of independent data analytics as your business’s nervous system—constantly sensing, processing, and responding to signals that keep your operation healthy and growing. As an independent data analyst, you’re not just tracking numbers—you’re translating them into smarter decisions and stronger results. It’s the systematic collection, statistical analysis, examination, and interpretation of business metrics to forge informed decisions about your independent work. This transcends simple time logging to unearth the deeper patterns that propel profitability, productivity, and sustainable growth.
Consider it your personal business intelligence apparatus—a mechanism to illuminate critical questions like: Which clients generate the most profit per hour of effort? What marketing channels magnetize the highest-value projects? When does your cognitive horsepower peak, and how can you architect your day around those golden hours?
Unlike corporate analytics that often drowns in vanity metrics, freelance data analytics laser-focuses on actionable intelligence. Every metric you monitor should directly inform a decision that elevates your business trajectory.
Why Most Freelancers Leave Money on the Table Without Embracing the Demand for Data
The average freelancer hemorrhages $12,000-$15,000 annually through inefficient pricing, time management mishaps, and overlooked opportunities. Here’s the cascade of consequences when you operate in the data darkness:
Underpricing becomes endemic. Without scrutinizing your effective hourly rate across diverse project categories, you can’t pinpoint which assignments truly pay. That logo design might seem lucrative at $500, but if it devours 20 hours including revisions, you’re earning a meager $25/hour—less than many retail positions.
Scope creep slithers undetected. When you don’t quantify project profitability, those “quick tweaks” and infinite revision loops silently corrode your margins like rust on steel. Data-savvy freelancers detect patterns early and fortify their contracts accordingly.
Marketing efforts fragment and scatter. You might be broadcasting daily on LinkedIn while your premium clients actually materialize from word-of-mouth referrals. Without monitoring lead sources and conversion ratios, you’re squandering precious business development resources.
Cash flow ambushes blindside you. Freelancers who scrutinize payment cycles and seasonal fluctuations can forecast lean months and prepare accordingly. Those who don’t often face the whiplash of feast-or-famine cycles.
What to Track in Freelance Data Analysis: Key Metrics That Matter
Financial Metrics
Your financial data constructs the bedrock of intelligent independent business decisions. Commence with these cornerstone metrics:
Average Hourly Rate by Project Type: Don’t merely document your quoted rate—calculate what you genuinely earn after incorporating all time invested. A $2,000 website project consuming 80 hours yields just $25/hour, while a $500 consultation spanning 2 hours generates $250/hour—a tenfold difference hiding in plain sight.
Monthly Recurring Revenue (MRR): The holy grail of freelance stability, your MRR represents the predictable income streams that transform your business from a rickety boat to a steady ship. Monitor retainer clients, subscription services, and any reliable income streams. Aspire to cultivate MRR to cover at least 50% of your monthly expenses.
Client Lifetime Value (CLV): Compute the total revenue each client contributes throughout your entire relationship. This metric unveils which client archetypes merit your premium attention and justifies higher acquisition investments for valuable long-term partnerships.
Profit Margin by Service: Revenue minus all associated costs (tools, subcontractors, administrative time) divided by revenue. You might uncover that your highest-revenue service actually harbors the lowest profit margin—a sobering revelation.
Productivity Metrics
Time represents your most finite resource. These metrics help you maximize its yield:
Billable vs. Non-billable Hours Ratio: Industry leaders sustain a 70/30 split. Chronicle where non-billable time evaporates—administration, marketing, learning—and optimize relentlessly.
Project Completion Time vs. Estimates: If you consistently underestimate by 30%, you’re either undercharging or overpromising. Leverage historical data to craft more precise proposals.
Peak Productivity Windows: Document your energy levels and output quality throughout the day. Schedule demanding tasks during peak periods and routine items during natural ebbs.
Client Relationship Metrics
Your client portfolio represents an asset demanding active stewardship:
Client Retention Rate: What percentage of clients return for additional projects? A rate below 30% signals dysfunction in delivery or relationship nurturing.
Net Promoter Score (NPS): Query clients, “How likely are you to recommend me to a colleague?” on a 1-10 scale. Scores of 9-10 are promoters, 7-8 are passive, and below 7 are detractors. Calculate NPS by subtracting the percentage of detractors from promoters.
Response Time Impact: Monitor how swiftly you respond to inquiries and correlate with win rates. Analysis often shows that responses within 1 hour boast 70% higher conversion rates than those after 24 hours.
Time Management, Productivity & Data Analysis Workflows
Successful freelancers treat time like a strategic asset, not a renewable resource. Here’s how to dissect yours:
The True Cost of Context Switching
Research demonstrates it requires an average of 23 minutes to fully refocus after an interruption—like trying to restart a cold engine repeatedly. Monitor your daily interruptions and calculate the hidden toll. If you toggle contexts 10 times daily, you’re hemorrhaging nearly 4 hours of productive time.
One freelance developer unearthed she was checking email 47 times per day—like a digital slot machine addiction. By consolidating email into three daily sessions, she reclaimed 2.5 hours of deep work time, translating to an extra $15,000 in billable hours annually. By reducing distractions and batching tasks, she not only improved her ability to focus deeply but also elevated her overall operational efficiency, allowing more client-facing output in less time.
Energy Management Over Time Management
Chronicle not just when you operate, but how effectively. Rate your energy levels hourly for two weeks, then map this against your task completion quality. You’ll likely unearth patterns like:
- Creative output flows like honey in morning hours (8-11 AM for most)
- Administrative tasks feel manageable during post-lunch dips (1-3 PM)
- Client calls energize some people but drain others like vampires
Harness these insights to architect your ideal workday structure. Schedule client presentations during high-octane windows and preserve routine tasks for natural low points.
The Pomodoro Data Approach
Don’t just employ Pomodoro timers—mine the metrics they generate. Monitor:
- Average pomodoros completed daily
- Task types that demand more/fewer intervals
- Your optimal work/break ratios (might deviate from the standard 25/5)
Financial & Revenue Metrics for Freelancers
Money metrics transcend simple income tracking. Here’s what financially sophisticated freelancers scrutinize:
Effective Hourly Rate (EHR) Calculation
Your EHR illuminates the truth about project profitability like a searchlight in fog:
Formula: Total Project Fee ÷ All Hours Invested = EHR
Include everything: initial consultations, project execution, revisions, administrative time, and follow-up. An independent designer who meticulously tracked her logo projects discovered:
- Quoted rate: $100/hour
- Average project fee: $1,500
- Total time invested: 25 hours
- Actual EHR: $60/hour
This 40% chasm prompted her to restructure packages, constrain revisions, and monetize consultations.
Cash Flow Forecasting
Construct a streamlined spreadsheet that monitors:
- Outstanding invoices by due date
- Confirmed upcoming projects
- Historical payment delays by client
- Seasonal revenue patterns
With three months of financial records, you can predict cash positions 60–90 days out with 80% accuracy. This foresight prevents panic during drought periods and enables strategic investments during abundance.
Project Profitability Matrix
Create a 2×2 grid plotting projects by revenue (Y-axis) and profit margin (X-axis):
- High Revenue + High Margin: Your sweet spot—pursue aggressively
- High Revenue + Low Margin: Optimize processes or elevate prices
- Low Revenue + High Margin: Consider productizing or scaling
- Low Revenue + Low Margin: Phase out strategically
Client Value & Relationship Data
Not all clients are created equal. Client performance metrics help you identify and cultivate the ones that matter:
Client Segmentation Framework
Divide your client base into four distinct tribes:
Champions (20% of clients, 60% of revenue): High-value, low-maintenance clients who evangelize your services. Document their common characteristics and hunt for similar prospects.
Supporters (30% of clients, 25% of revenue): Reliable, mid-tier clients who form your stable foundation. Maintain robust relationships and explore upsell opportunities.
Transactionals (40% of clients, 12% of revenue): One-off projects with limited growth potential. Serve efficiently but don’t over-invest resources.
Drains (10% of clients, 3% of revenue): High-maintenance, low-value clients who siphon your energy. Document why they’re problematic and develop filters to repel similar prospects.
Communication Efficiency Metrics
Track email volleys per project and correlate with client satisfaction. One consultant discovered that projects averaging over 50 emails had 3x higher revision rates and 40% lower satisfaction scores. She now embeds communication protocols in contracts, clearly defines each deliverable upfront, and charges premiums for high-touch clients.
Lead Generation & Marketing Metrics
Your marketing efforts demand measurement to evolve:
Channel Attribution Tracking
Craft a straightforward spreadsheet with columns for:
- Lead source (LinkedIn, referral, website, etc.)
- Initial contact date
- Proposal sent (Y/N)
- Project won (Y/N)
- Project value
- Time to close
After cataloging 50 leads, patterns crystallize. You might discover—using simple web analytics tools—that website leads convert at 10%, while online gig platforms like Upwork or Fiverr convert at 25%. These conversion insights justify investing more energy in cultivating your referral ecosystem.
Content ROI Analysis
If you blog or create content, monitor:
- Time invested per piece
- Views/engagement within 30 days
- Leads generated within 90 days
- Revenue attributed within 180 days
Use web analytics tools like Google Analytics or Plausible to track traffic sources, bounce rates, and visitor behavior that help attribute results more accurately.
One freelance writer invested 10 hours crafting a comprehensive guide that magnetized three ideal clients worth $25,000 total—delivering a return on investment of $2,500 per hour invested.
Top Tools for Freelance Data Analysis Work in 2025
The right data analytics tools for freelancers transform tracking from a chore into a powerful competitive advantage. Here’s what works —
Time Tracking Tools
Toggl Track: The gold standard for simplicity. One-click tracking, detailed reports, and integrations with 100+ apps. Ideal for freelancers who need clean time records without complexity.
RescueTime: Operates silently in the background, automatically categorizing your computer usage. Reveals shocking truths about where time actually evaporates versus where you believe it goes. For a full breakdown of the best automatic time tracking software for freelancers in 2025, read our Ultimate Guide to Automatic Time Tracking Software.
Clockify: Free forever with unlimited tracking. Perfect for freelancers embarking on their time analytics journey.
Financial Management
QuickBooks Self-Employed: Automatically segregates business/personal expenses, calculates quarterly taxes, and tracks mileage. The mobile receipt scanning salvages hours monthly.
Wave: Complimentary accounting software that handles invoicing, expense tracking, and fundamental reporting. Ideal for freelancers under $50K annual revenue.
FreshBooks is one of the most user-friendly data analytics tools for freelancers that help businesses make better decisions across a wide range of services like project-based accounting, profitability tracking, and invoicing.
All-in-One Solutions
Notion is one of the most user-friendly data analytics tools for freelancers, allowing you to construct custom databases for clients, projects, and key metrics.. Its flexibility makes it ideal for organizing your data management processes while juggling multiple remote freelance analytics jobs across industries.. Free for personal use.
Airtable: Where spreadsheet meets database in perfect harmony. It also enables basic data visualization for freelancerswho’ve outgrown Google Sheets but aren’t ready for enterprise complexity.
Monday.com: Visual project management with embedded analytics. Observe your pipeline, monitor project stages, and identify bottlenecks instantaneously.
Manual Tracking: Building a Spreadsheet Dashboard
Sometimes simplicity reigns supreme. Here’s how to construct a powerful Google Sheets command center:
Programming Tools: Python for Freelance Data Automation and Analysis
For tech-savvy freelancers, **Python** is a game-changer in 2025. It allows you to build custom scripts to automate data collection, clean messy datasets, and run deep analysis across multiple sources. Whether you’re generating automated reports, parsing API data from remote work platforms, or training basic machine learning models, Python delivers unmatched flexibility.
Pair it with libraries like Pandas, NumPy, and Matplotlib to unlock the full power of information processing and visual storytelling. Even basic Python skills can help freelancers streamline repetitive tasks and uncover insights not visible in spreadsheets alone.
Essential Tracking Tabs
Weekly Freelancer KPI Dashboard (Visual Example)
Track your key performance metrics weekly to identify trends and take action on what’s working. For a ready-made, visual template, check out our KPI Dashboard Template: Turn Your Freelance Numbers Into Growth in 2025.
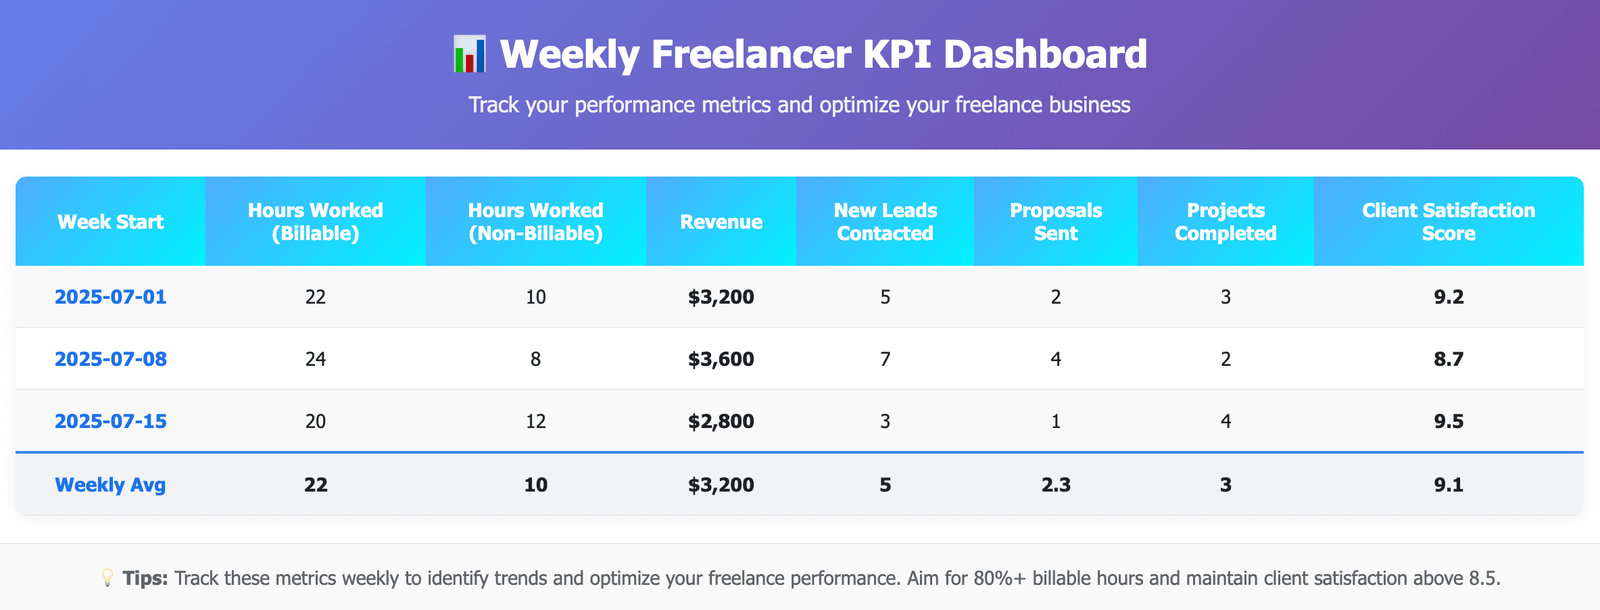
Download this KPI scorecard as a template or recreate it in Google Sheets to start optimizing your freelance business every week.
Weekly Scorecard: Create columns for:
- Week starting date
- Revenue generated
- Hours worked (billable/non-billable)
- New leads contacted
- Proposals sent
- Projects completed
- Key wins/challenges
Client Database: Monitor:
- Client name and contact
- Total revenue to date
- Project count
- Average project value
- Last contact date
- Satisfaction rating
- Referral status
Financial Dashboard: Observe:
- Monthly revenue (actual vs. goal)
- Outstanding invoices
- Expense categories
- Profit margins
- Tax reserves
- Emergency fund balance
Automation Within Sheets
Deploy these formulas to reclaim time:
SUMIFto automatically calculate revenue by client or project typeAVERAGEIFto find average project values by categorySPARKLINEtto create mini-charts showing trends, or export your data to Power BI or Tableau for advanced interactive dashboards and data storytelling visuals. For a complete guide on visualizing your freelance metrics to attract premium clients, read our Freelance Data Visualization 2025 guide.QUERYto filter and analyze data dynamically
For even deeper analysis, experienced freelancers often export their spreadsheet records into SQL databases, allowing them to run complex queries, join multiple information sources, and generate custom reports that go far beyond the capabilities of basic formulas.
Data Analysis-Driven Decision-Making Framework for Freelancers
Effective data-driven decision making starts by asking the right questions and using real metrics — not gut feelings — to guide your freelance business. To see how real freelance data analysts apply this in practice, check out our guide How Freelance Data Analysts Use Data to Make Smarter Business Decisions in 2025.
Possessing raw insights means nothing without activation. Follow this five-step methodology:
Step 1: Define the Decision
Be laser-specific. Instead of “Should I raise prices?” ask “Should I escalate my web design package from $3,000 to $4,000?”
Step 2: Gather Relevant Data
For the pricing example, accumulate:
- Current win rate at $3,000
- Competitor pricing for comparable services
- Your effective hourly rate
- Client feedback on value perception
- Market demand indicators
Step 3: Analyze Objectively
Eliminate emotion from the equation. What narrative does the evidence weave? If your win rate is 80% and competitors charge $4,500-5,000, you have latitude to ascend.
Step 4: Model Scenarios
Calculate potential outcomes:
- Current: 10 projects × $3,000 × 80% win rate = $24,000
- Increased: 10 projects × $4,000 × 60% win rate = $24,000
- But if win rate only declines to 70%: $28,000 (17% revenue surge)
Step 5: Implement and Monitor
Execute the change with an experimental mindset. Monitor results for 30–60 days, then calibrate based on real-world evidence, not assumptions.
Case Studies: Real Freelancers Using Data for Growth
Case Study 1: Sarah’s Design Agency Transformation
Sarah, an independent graphic designer, was grinding through 60-hour weeks but barely breaking even.. Her data excavation revealed:
- Logo projects: $50/hour effective rate
- Brand strategy sessions: $200/hour effective rate
- 70% of time consumed by low-impact tasks
She restructured her services, mandating strategy sessions before any creative execution.. Result: 40-hour weeks, 150% revenue escalation, and delighted clients who valued her strategic acumen.
Case Study 2: James Optimizes His Development Practice
James meticulously tracked every project for six months, including several data analytics freelance projects, and unearthed:
- Enterprise clients paid 3x more but demanded 5x more communication
- Startup clients paid less but generated more referrals
- E-commerce projects had 90% on-time completion vs. 60% for custom applications
By analyzing patterns across his diverse client base, especially in data analytics freelance projects, he specialized in e-commerce for funded startups—tripling his effective hourly rate while significantly diminishing stress.
Case Study 3: Maria’s Content Writing Scale-Up
Maria analyzed two years of content writing performance metrics:
- Blog posts: $0.15/word average
- White papers: $0.40/word average
- Email campaigns: $0.50/word average
- Time per word remained nearly identical across all types
She pivoted to email marketing exclusively, partnering with three agencies for ongoing client engagements. By leveraging her data analysis skills, revenue surged 250% while working 25% fewer hours.
Case Study 4: Alex’s Photography Business Intelligence
Alex, an independent photographer, felt like he was spinning his wheels despite constant bookings. His three-month data deep dive exposed:
- Wedding photography: $125/hour after editing time
- Corporate headshots: $450/hour with minimal post-processing
- Real estate photography: $200/hour with predictable workflow
- Weddings generated 80% of complaints but only 35% of profit
He transitioned to corporate and real estate exclusively, doubling his income while reclaiming weekends. Client satisfaction scores jumped from 7.2 to 9.4.
Case Study 5: Rachel’s Consulting Pivot
Rachel, a marketing consultant, discovered through meticulous tracking:
- Strategy workshops: Generated $8,000 average project value
- Implementation phase: Generated $2,500 average project value
- Workshops led to 65% repeat business vs. 20% for implementation
- Workshop prep required 5 hours vs. 40 hours for implementation projects
She eliminated implementation services entirely, focusing on high-value strategy workshops. Monthly revenue increased 185% while working 50% fewer hours.
Build a Freelance Data Analyst Portfolio That Wins High-Paying Work
Many freelancers struggle to stand out in a crowded market—but those who build freelance data portfolio assets backed by real metrics and insights consistently attract higher-paying clients.
Your analytical prowess can become a magnetic differentiator. Clients increasingly look for data analytics experts with strong analytical skills who can deliver measurable results. Here’s how to showcase it:
Create a Results Dashboard
Forge a compelling one-page PDF showcasing:
- Total projects completed
- Average client satisfaction score
- On-time delivery rate
- Years of experience
- Specialized certifications
- Key performance improvements
Update quarterly and embed in proposals. Clients gravitate toward freelancers who measure their own performance with precision.
Evidence-Based Case Studies
Instead of nebulous testimonials, present concrete results:
- “Amplified client’s email open rates by 34% through systematic A/B testing”
- “Compressed project delivery time by 25% using agile methodologies”
- “Generated 150% ROI through laser-targeted content strategy”
Insight-Based Packages
Position yourself as a strategic ally:
- Embed performance tracking in your proposals
- Offer monthly analytics reports as a premium enhancement
- Guarantee specific metrics (with appropriate disclaimers)
Common Mistakes in Freelance Analytics (And How to Avoid Them)
Mistake 1: Analysis Paralysis
Problem: Investing more time tracking than executing billable work—like polishing your tools instead of building. For more blind spots that cost freelancers time and money, explore our Top 10 Data-Driven Decision-Making Mistakes for Freelancers (2025).
Solution: Initiate with three metrics maximum. Add complexity only after you’re consistently leveraging initial insights for decisions
Mistake 2: Tracking Vanity Metrics
Problem: Obsessing over follower counts instead of lead quality—counting seeds instead of harvesting crops.
Solution: Every metric should answer: “So what?” If it doesn’t catalyze action, cease tracking it.
Mistake 3: Ignoring Seasonal Patterns
Problem: Panicking during predictable slow periods—like a farmer surprised by winter.
Solution: Chronicle monthly trends for at least one complete year. Accumulate reserves during busy seasons to weather predictable droughts.
Mistake 4: Not Acting on Data
Problem: Hoarding insights but perpetuating old patterns—like reading a map but never changing course.
Solution: Schedule monthly “insight action days” where you review metrics and implement at least one modification based on discoveries.
Advanced Data Analysis Tools: AI, Predictive Models & Workflow Automation
The future of independent analytics work has arrived:
AI-Powered Insights
Leverage ChatGPT or Claude to dissect your data:
- Export your metrics to CSV
- Upload to AI with targeted questions
- Receive instant analysis and recommendations
AI can simulate the expertise of a skilled analytics professional, helping you uncover patterns that drive smarter business decisions—especially when combined with machine learning algorithms for predictive insights. While these tools lower the barrier to entry, developing even a moderate level of information literacy and analytical proficiency empowers freelancers to validate results, spot anomalies, and apply findings more confidently.
Example prompt:
“Analyze my client revenue data and identify the top 20% of clients generating 80% of revenue. What characteristics do they share?”
Predictive Modeling in Sheets
Utilize Google Sheets’ FORECAST function to anticipate:
- Future revenue based on historical trajectories
- Busy seasons requiring additional support
- Cash flow gaps demanding attention
Automation Workflows
Smart Freelancer Automation Workflow: From Lead to Testimonial on Autopilot
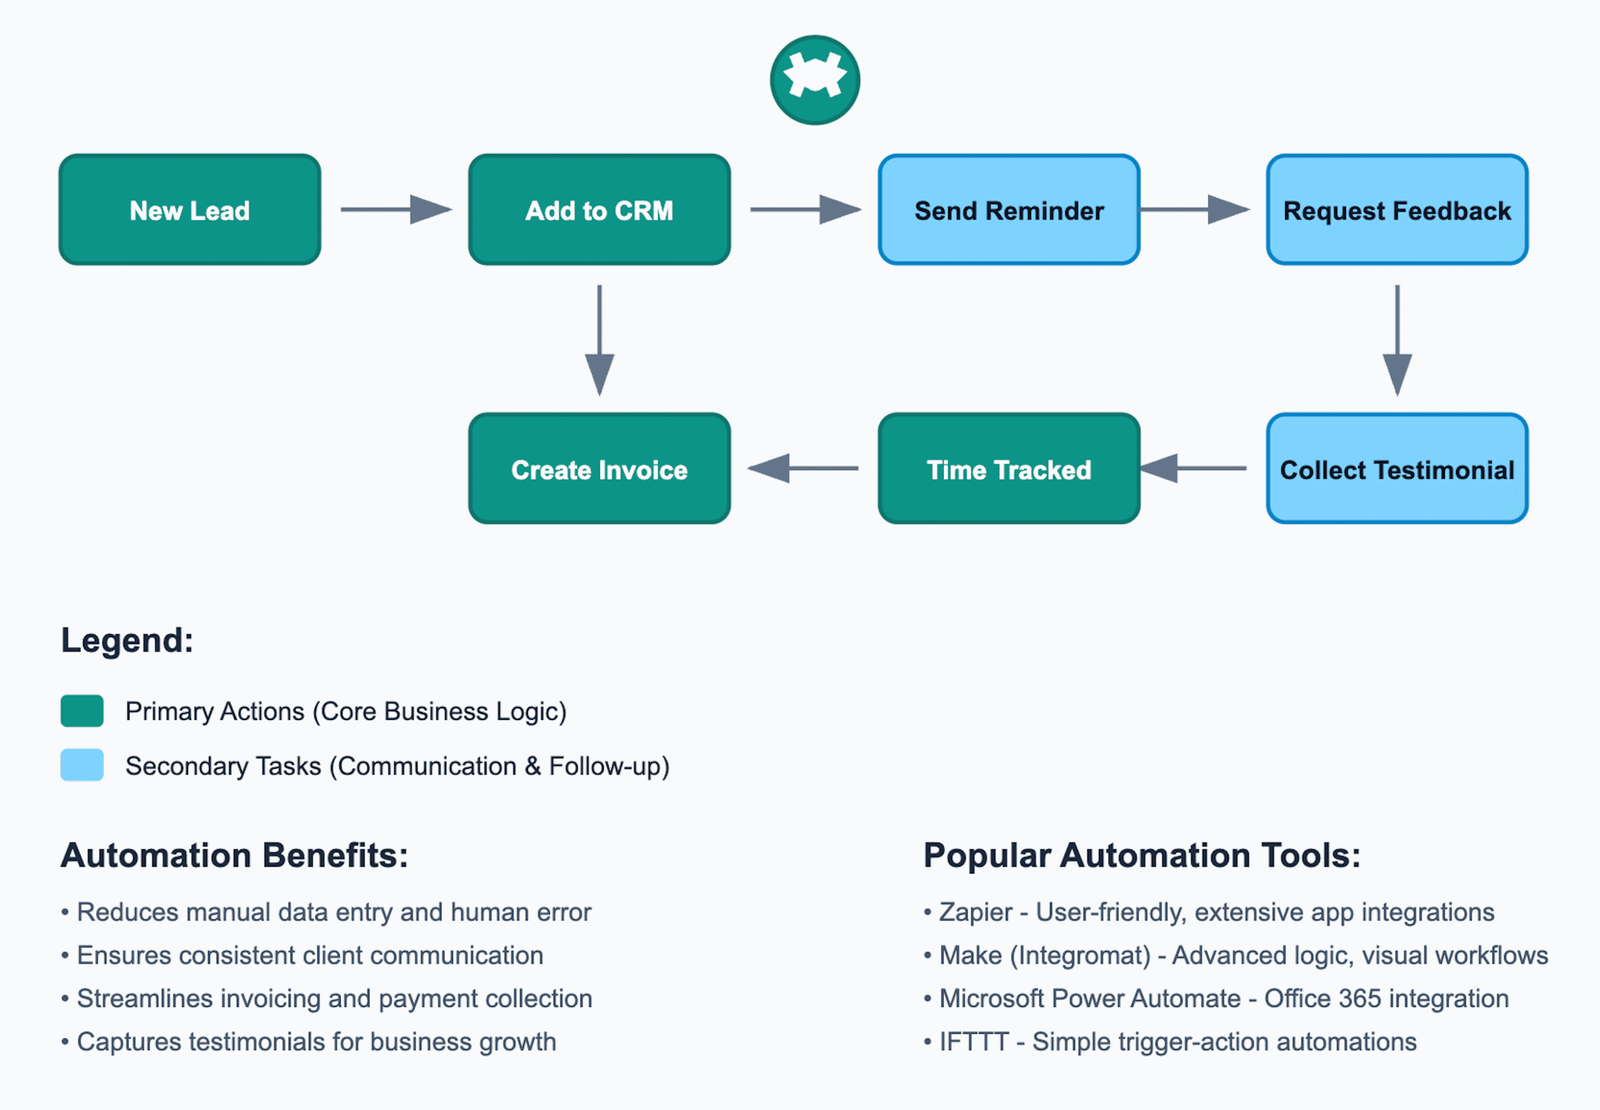
Use this workflow to automate lead capture, CRM entry, invoicing, and testimonial collection — all with free tools like Zapier or Make.
Connect your tools using Zapier or Make to create a self-running business machine:
- Time tracking → Invoice generation
- New lead → CRM entry + follow-up reminder
- Project completion → Feedback request + testimonial prompt
30-Day Freelance Data Setup Roadmap
Week 1: Foundation Building
Days 1-3: Select and configure time tracking tool. Begin tracking all efforts, including non-billable tasks.
Days 4-7: Construct basic spreadsheet with client, revenue, and time tabs. Back-populate last month’s data if available.
Week 2: Gathering Business Intelligence
Days 8-10: Establish financial tracking—connect bank accounts, categorize expenses, create invoice templates.
Days 11-14: Deploy client feedback system. Dispatch brief surveys to recent clients investigating satisfaction and improvement areas.
Week 3: Analysis and Insights
Days 15–17: Begin KPI tracking for freelancers by calculating your inaugural metrics—effective hourly rate, client concentration risk, and billable hours percentage.
Days 18-21: Dig into the numbers to uncover surprising patterns.
Week 4: Strategic Implementation
Days 22-24: Execute one significant change based on data insights—adjust pricing, terminate a problematic client, or restructure a service.
Days 25-28: Create automated reports and dashboards. Set calendar reminders for weekly and monthly reviews.
Days 29-30: Document your system and commit to consistent tracking.
Legal & Ethical Considerations
Collecting information comes with responsibilities:
Privacy Compliance
- Never track client information without explicit consent.
- Include information management clauses in your contracts
- Utilize encrypted storage for sensitive information
- Comply with GDPR/CCPA when applicable
Transparent Practices
- Maintain candor about what you track and why
- Share relevant metrics with clients when appropriate
- Use insights to improve your service—not to take advantage of trust
- Preserve confidentiality across client projects
Frequently Asked Questions
What’s the minimum data I should track as a freelancer?
Start with three essential metrics: time spent per project (to calculate effective hourly rate), revenue by client (to identify your most valuable relationships), and monthly expenses (to understand true profitability). You can build complexity from this foundation, but these three provide immediate actionable insights.
How do I track metrics without expensive software?
Google Sheets is perfectly adequate for most freelancers. Create three tabs: Time Log (date, client, project, hours), Financial Tracker (income, expenses, invoices), and Client Database (contact info, total revenue, project history). Free tools like Clockify for time tracking and Wave for invoicing can supplement your spreadsheet system.
Which single metric has the biggest impact on freelance income?
Effective Hourly Rate (EHR) drives the most dramatic improvements. Calculate it by dividing total project fee by all hours invested, including admin time, revisions, and communication. Most freelancers discover they earn 40–60% less than their quoted rate, leading to immediate pricing and process improvements.
How do I analyze data if I’m not good with numbers?
Focus on simple comparisons rather than complex calculations. Ask basic questions: Which clients pay most promptly? Which projects take longer than estimated? Which services do I love offering that are also profitable? Use AI tools like ChatGPT to help with data analysis — simply export to CSV and ask for insights.
Should I track non-billable time?
Absolutely. Non-billable time reveals where your business needs optimization. If you spend 15 hours weekly on admin tasks, that’s nearly $30,000 in lost billable time annually (at $100/hour). Tracking helps you identify tasks to automate, delegate, or eliminate.
How long before I see results from data tracking?
Most freelancers report initial insights within 7–10 days of consistent tracking. Major improvements typically emerge after 30–60 days when you have enough data to spot patterns. The key is consistency — incomplete data leads to incorrect conclusions.
What’s the difference between KPIs and vanity metrics for freelancers?
KPIs directly impact your business decisions: client lifetime value influences marketing spend, effective hourly rate drives pricing strategy, and pipeline velocity affects cash flow planning. Vanity metrics like social media followers or website visits feel good but rarely correlate with revenue or profitability.
Conclusion: Make Data Your Competitive Edge
Data analytics isn’t about becoming a spreadsheet wizard — it’s about making smarter decisions with crystal-clear insight. In 2025, the most successful freelancers won’t just rely on talent — they’ll act like data analysts, turning raw numbers into strategy, and strategy into income.
But you don’t need a PhD or expensive software to get started. You just need to start small and act intentionally.
Choose one metric — maybe your effective hourly rate or client retention — and track it for 30 days.
Then make one concrete decision based on what you learn.
That’s how real growth begins.
The freelancers flourishing today aren’t lucky — they’re informed. They know which clients to pursue, which services to double down on, and which distractions to ignore. That kind of clarity only comes from data.
Your competition is already tracking. Your ideal clients are already measuring.
So the question isn’t whether to start.
It’s when — and why not today?
Want exclusive templates and tools?
👉 Join Freelance Boosters on Telegram to stay one step ahead with weekly insights and data tools.
📊 Explore More from the Freelance Data Hub
Want to go deeper with your data strategy? Explore these actionable guides:
-
❌
Top 10 Data-Driven Decision-Making Mistakes for Freelancers (2025)
Fix the blind spots that quietly drain your revenue and focus. -
⏱️
Ultimate Guide to Automatic Time Tracking Software for Freelancers
Automate your time logs and uncover your true hourly rate. -
📊
KPI Dashboard Template: Turn Your Freelance Numbers Into Growth in 2025
Create visual dashboards that highlight performance and profit. -
📈
How to Master Freelance Data Visualization to Attract High-Paying Clients
Turn raw numbers into persuasive stories and premium deals. -
💡
How Freelance Data Analysts Use Data to Make Smarter Business Decisions in 2025
See how pros turn metrics into money and insight into action.