Top 10 Data-Driven Decision-Making Mistakes for Freelancers (2025)

Introduction: Why Most Freelancers Struggle With Data-Driven Decision-Making
Running a successful freelance business in 2025 requires more than just delivering great work — it demands smart, data-driven decision-making. Yet, according to the MBO Partners’ State of Independence report, the majority of freelancers admit they make business decisions based on gut feeling rather than concrete data. This approach might work in the short term, but relying solely on intuition weakens your overall decision-making process and leads to stagnation and missed opportunities.
The harsh reality? Poor data-driven decision-making is silently sabotaging your income potential. While your competitors are leveraging big data to optimize their rates, client acquisition strategies, and operational efficiency through smart freelance business analytics, you might be leaving thousands of dollars on the table.
In this comprehensive guide, you’ll discover the 10 most critical data-driven decision-making mistakes that are holding you back — and learn exactly how to fix them. From tracking the wrong metrics to ignoring crucial performance indicators, we’ll transform your approach to freelance business intelligence. For advanced techniques, see our guide on how to use freelance data to make better business decisions in 2025..
Mistake #1: No Data Tracking — A Critical Freelance Decision-Making Flaw
The Problem: No Data Means No Informed Decisions
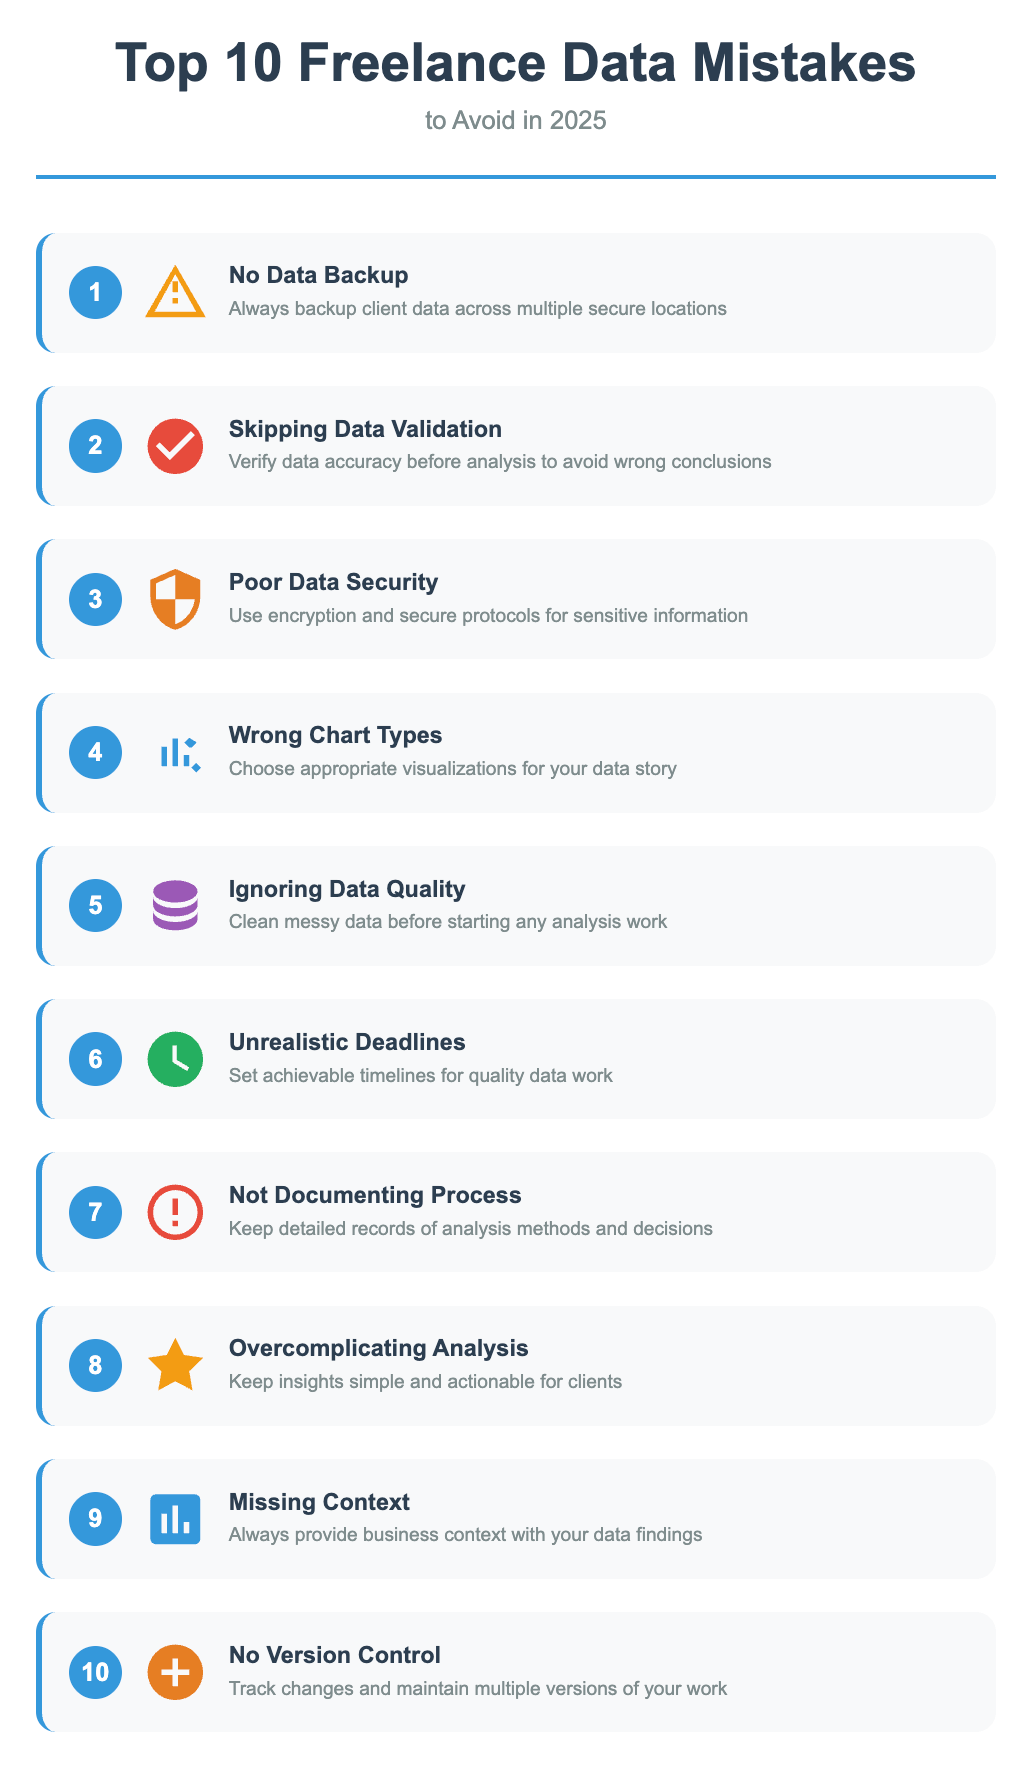
The biggest data driven decision making mistake is surprisingly common: 68% of solo freelancers track zero business metrics beyond basic income. They operate entirely on intuition, making one of the most widespread mistakes in data driven decision making — relying on gut feeling instead of data.
This approach creates several dangerous blind spots:
- No visibility into which clients or projects are actually profitable
- Zero insight into time allocation and productivity patterns
- Missing opportunities to identify your most valuable services through client profitability analysis
- Inability to justify rate increases or strategic pivots
The Solution: Use a Simple Dashboard to Make Data-Driven Decisions
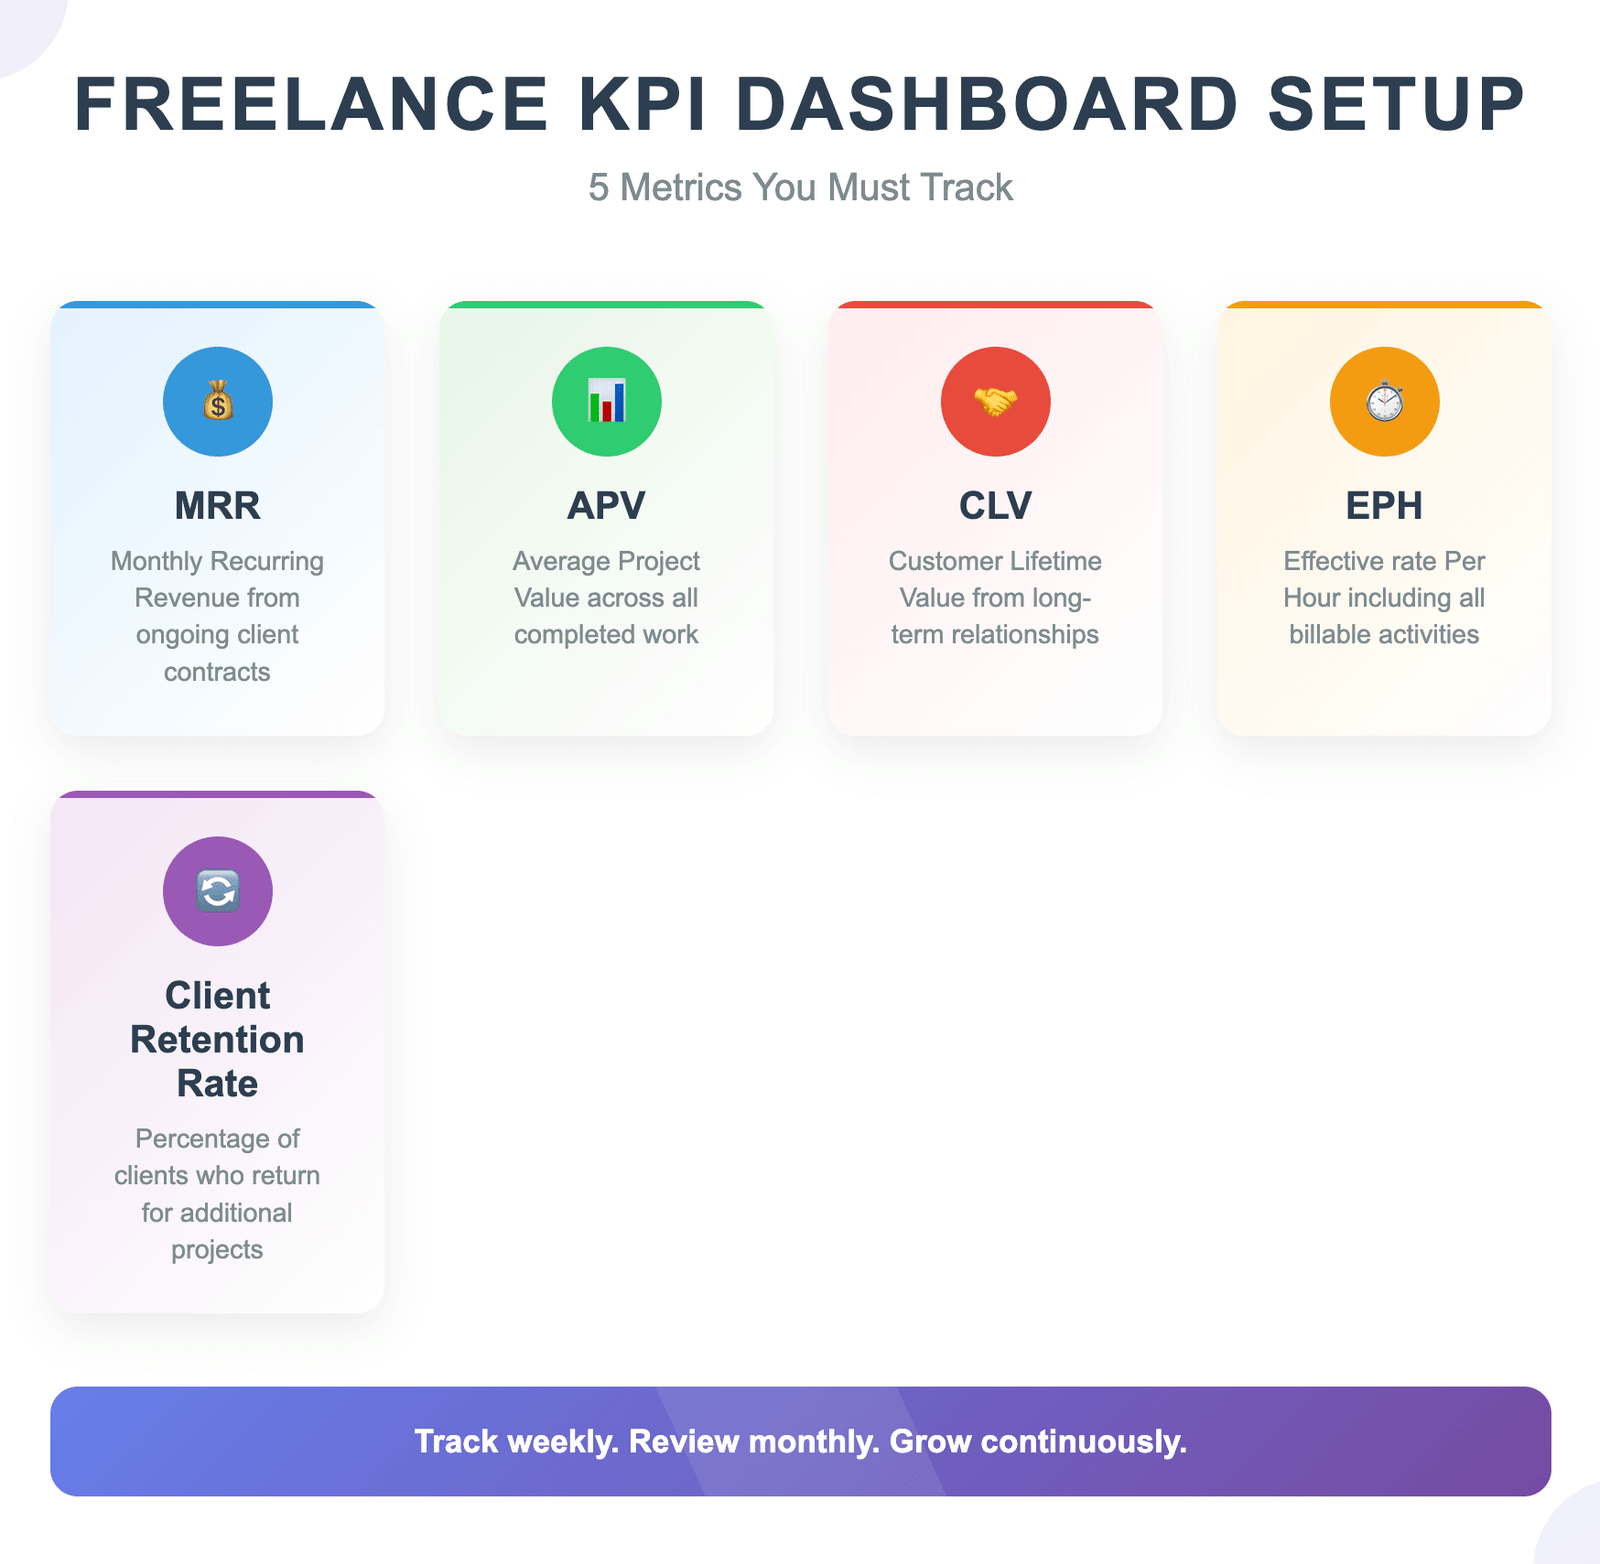
Don’t overwhelm yourself with complex analytics. Begin with these three fundamental metrics for effective KPI tracking for freelancers:
- Monthly Recurring Revenue (MRR) — Track consistent income streams
- Average Project Value (APV) — Monitor deal size trends
- Client Lifetime Value (CLV) — Understand long-term relationship worth
Quick Setup Guide:
- Use a simple spreadsheet or tool like Notion
- Spend 10 minutes weekly updating these numbers
- Set monthly targets for each metric
- Review trends every 30 days
👉 For a complete setup guide, check out our Ultimate Guide to Data Analytics for Freelancers
↑ Back to Table of ContentsMistake #2: Tracking Too Many Metrics (Analysis Paralysis)
The Problem: Drowning in Data Without Direction
On the flip side, some freelancers fall into the KPI overload trap. They track everything: email open rates, social media engagement, website bounce rates, project completion times, and dozens of other metrics that don’t directly impact their bottom line.
This creates analysis paralysis — a classic example of poor data driven decision making — where you spend more time analyzing data than using it to confidently make decisions that drive profit. Research shows that tracking too many KPIs can lead to slower decision-making and strategic confusion. As ClearPoint Strategy explains, focusing on fewer, high-impact metrics significantly improves performance and clarity.
The Solution: Use Key Metrics to Drive Data-Driven Decision-Making
Choose metrics that directly correlate with income growth and support data driven decision making:
High-Impact KPIs:
- Earnings Per Hour (EPH) — Your true hourly value
- Client Retention Rate — Percentage of repeat clients
- Project Profit Margin — Revenue minus all costs
- Lead-to-Client Conversion Rate — Sales efficiency
- Average Response Time — Client service quality
Low-Impact Metrics to Avoid:
- Social media followers (unless you’re a social media freelancer)
- Email open rates (focus on response rates instead)
- Website traffic (unless driving direct leads)
Mistake #3: Ignoring Earnings per Hour (EPH)
The Problem: Misunderstanding Your True Profitability
Many freelancers think they know their hourly rate, but they’re calculating it wrong. They divide project payment by billable hours, ignoring crucial factors for accurate earnings per hour freelance calculations like:
- Client communication time
- Project research and preparation
- Revisions and feedback cycles
- Administrative tasks
- Unpaid time between projects
This data driven decision making mistake leads to systematic underpricing and burnout.
The Solution: Use EPH Data Analysis to Set Profitable Freelance Pricing
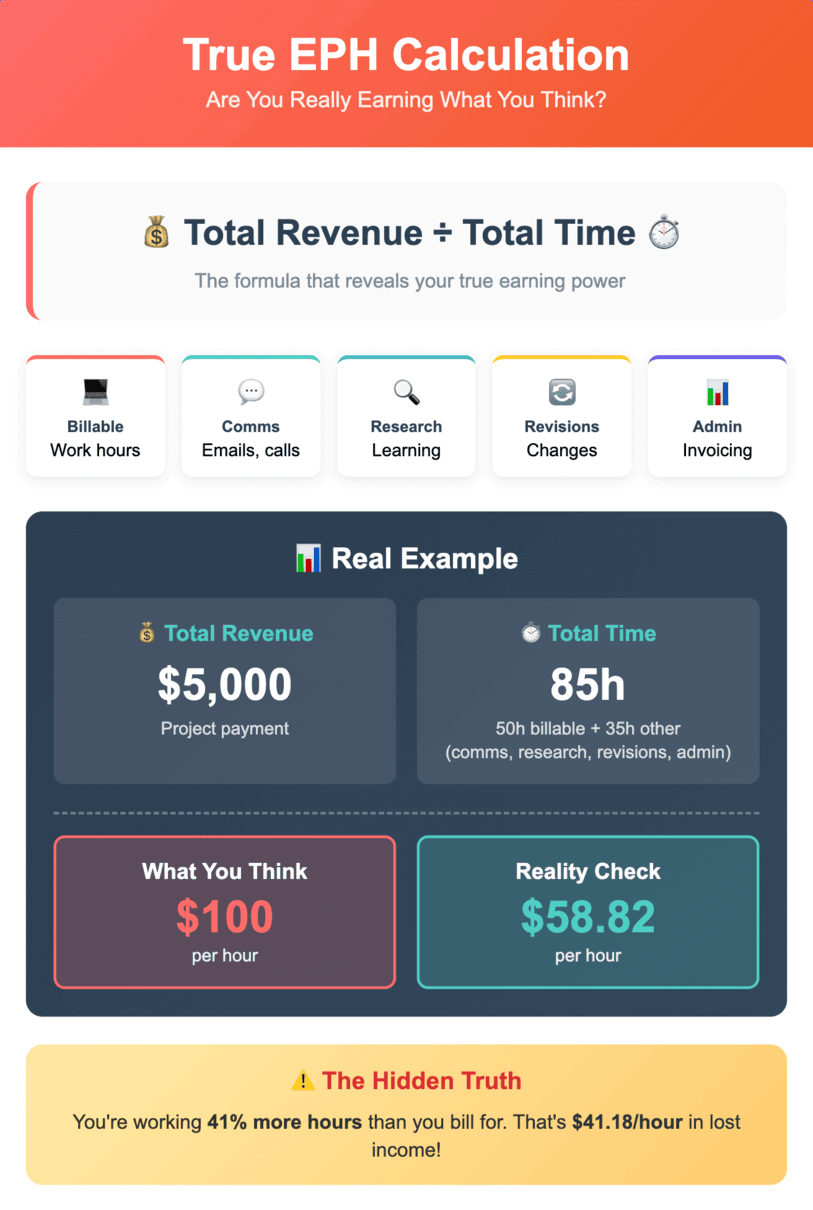
EPH Formula:
True EPH = Total Project Revenue ÷ Total Time Invested
Total Time Invested includes:
- All billable hours
- Communication (emails, calls, meetings)
- Research and planning
- Revisions and edits
- Administrative work (invoicing, project setup)
Example Calculation:
- Project Payment: $2,000
- Billable Hours: 20 hours
- Communication: 5 hours
- Research: 3 hours
- Revisions: 4 hours
- Admin: 2 hours
- Total Time: 34 hours
- True EPH: $58.82 (not $100 as initially calculated)
Use this real EPH to:
- Set minimum project rates
- Identify your most profitable service types through client profitability analysis
- Negotiate better rates with data backing
👉 Learn more about strategic pricing in our Freelance Pricing: Hourly vs Fixed Rates guide
↑ Back to Table of ContentsMistake #4: No Review System — Weak Spot in Data-Driven Decision-Making
The Problem: Data Without Analysis Blocks Smart Decision-Making
73% of freelancers who track metrics admit they rarely review them systematically. This scattered approach is one of the most damaging data driven decision making mistakes, preventing any meaningful business insights or effective business strategies from emerging.
This creates a false sense of data driven decision making — one of the most deceptive mistakes — while missing critical insights and trends.
The Solution: Review Cycles That Support Data-Driven Decision-Making
Weekly Review (30 minutes):
- Update core KPIs
- Identify immediate issues or opportunities
- Adjust weekly priorities based on data
- Track progress toward monthly goals
Monthly Review (90 Minutes) to Make Data-Driven Decisions with Confidence:
- Analyze trends and patterns
- Compare performance to previous months
- Identify top-performing clients/projects
- Plan strategic adjustments for next month
Quarterly Review (3 hours):
- Comprehensive business performance analysis
- Rate and pricing optimization
- Service offering evaluation
- Annual goal progress assessment
👉 Get our complete review system in the Freelance Weekly Planning System for 2025
↑ Back to Table of ContentsMistake #5: Not Visualizing Data — A Common Freelance Analytics Mistake
The Problem: Data Living in Spreadsheet Limbo
Relying solely on raw numbers without proper data visualization is another overlooked mistake that slows data driven decision making. Common pitfalls in freelance business analytics include storing data in complex Excel files that require mental gymnastics to understand trends and patterns.
When data isn’t visual, you miss:
- Quick trend identification
- Pattern recognition
- Easy client presentations
- Motivational progress tracking
The Solution: Create Simple, Visual Dashboards
Free Dashboard Tools for freelance data dashboards:
- Google Data Studio – Connect to spreadsheets automatically
- Notion — Built-in charts and progress bars
- Canva — Quick infographic creation
- Tableau Public — Advanced visualizations
One of the most accessible freelance analytics tools for visualizing KPIs is Google Looker Studio, — a platform often used in data science — which lets you turn your spreadsheets into dynamic dashboards in minutes without any coding required.. For real examples and templates, check out our guide on freelance data dashboards to turn your numbers into growth in 2025.
Essential Visual Elements:
- Line charts for revenue trends
- Bar charts for client comparisons
- Pie charts for service breakdown
- Progress indicators for goals
- Heat maps for time allocation
Pro Tip: Create one “executive summary” dashboard that shows all key metrics at a glance. Update it weekly and review it daily.
↑ Back to Table of ContentsMistake #6: No Data-Driven Client Reporting
The Problem: Clients Don’t See Your Value
Most freelancers deliver work without demonstrating the measurable impact they’ve created. This data driven decision making mistake makes it harder to:
- Justify rate increases
- Secure contract renewals
- Generate referrals
- Build long-term partnerships
Failing to present clear value through data storytelling for freelancers is among the most preventable mistakes, especially when clients only see the deliverables and not the impact. As AgencyAnalytics explains, consistent, data-driven client reports help freelancers demonstrate real business value and improve retention.
What to Include in Client Reports:
- Project completion metrics
- Quality indicators (revision rates, approval times)
- Business impact measurements
- Efficiency improvements
- Time-to-delivery comparisons
Monthly Client Report Template:
Project: [Name]
Completed: [Date]
Key Metrics:
- Delivered 2 days ahead of schedule
- 0 revisions required (vs. 2.3 industry average)
- [Specific business impact, e.g., “15% increase in conversion rate”]
- Client satisfaction score: 9.2/10
Next Month’s Focus:
- [Specific goals and metrics]
This approach transforms you from a service provider into a strategic partner.
↑ Back to Table of ContentsMistake #7: Not Segmenting Data
The Problem: Analyzing Everything Together
One of the common data driven decision making mistakes is averaging performance across all projects, which hides insights that can unlock higher profits. Data tracking errors freelancers make include treating all work equally when different:
- Client types have different profitability
- Project types require different time investments
- Service offerings have varying market demand
- Acquisition channels produce different quality leads
The Solution: Use Data to Segment Clients by Key Categories
Primary Segmentation Categories for better client profitability analysis:
- Client Size (Small business, Enterprise, Startup)
- Service Type (Strategy, Execution, Consulting)
- Project Duration (One-time, Short-term, Long-term)
- Acquisition Channel (Referral, LinkedIn, Content, Platforms)
- Industry Vertical (Tech, Healthcare, Finance, etc.)
Analysis Framework:
- Calculate EPH for each segment
- Identify highest-value client profiles
- Spot service offerings with best margins
- Optimize marketing spend by channel performance
Example Insight: “Enterprise clients pay 40% more per hour but require 60% more communication time, resulting in 12% lower EPH than mid-market clients.”
To go beyond analysis and actually use your segmented data to attract premium clients, read our full guide on How to Use Freelance Data to Attract High-Paying Clients in 2025.
↑ Back to Table of ContentsMistake #8: Ignoring Conversion Metrics
The Problem: No Sales Funnel Visibility
How freelancers misuse performance data often involves focusing on output metrics while ignoring input efficiency and conversion funnel metrics. This narrow focus is one of the more frequent data driven decision making mistakes — tracking results without understanding the conversion process behind them.
Key conversion metrics freelancers ignore:
-
- Lead-to-proposal rate — How many inquiries become formal proposals
- Proposal-to-client rate — Your closing percentage
- First-meeting-to-project rate — Discovery call effectiveness
- Referral conversion rate — Quality of referred leads
The Solution: Track Your Complete Sales Funnel
Sales Funnel Metrics to Monitor:
| Stage | Metric | Calculation | Target |
|---|---|---|---|
| Awareness | Monthly Leads | Total inquiries | 15–25 |
| Interest | Qualification Rate | Qualified leads ÷ Total leads | 40–60% |
| Consideration | Proposal Rate | Proposals sent ÷ Qualified leads | 80–90% |
| Decision | Win Rate | Won proposals ÷ Total proposals | 30–50% |
| Retention | Repeat Rate | Repeat clients ÷ Total clients | 40–60% |
Monthly Funnel Review Questions:
- Which stage has the biggest drop-off?
- What’s causing proposal rejections?
- Are qualified leads actually qualified?
- How can we improve win rates?
Mistake #9: No Data-Backed Pricing Adjustments
The Problem: Set-and-Forget Pricing Strategy
76% of freelancers haven’t adjusted their rates in over 12 months, and 89% have never A/B tested their pricing. This data driven decision making mistake leaves significant money on the table. As Payoneer highlights in their freelance pricing guide, regularly reviewing and adjusting your rates based on value and market response is key to earning what you’re truly worth.
Common pricing errors:
- Using outdated market rates
- Ignoring value-based freelance pricing opportunities
- Not testing price sensitivity
- Failing to adjust for expertise growth
The Solution: Implement Data-Driven Pricing Optimization
Pricing Analysis Framework:
- EPH Benchmarking:
- Calculate EPH for last 12 months
- Compare to industry benchmarks
- Identify improvement opportunities
- Client Willingness-to-Pay Testing:
- Test 15-20% higher rates with new prospects
- Track acceptance rates
- Measure impact on total revenue
- Value-Based Pricing Analysis:
- Calculate client ROI from your work
- Price based on value delivered, not time spent
- Use case studies to justify premium rates
- Competitive Analysis:
- Research similar freelancers’ rates
- Identify differentiators that justify higher prices
- Position services in premium market segments
Pricing Test Example:
- Current Rate: $75/hour
- Test Rate: $90/hour (+20%)
- Result: 15% lower acceptance rate, 4% higher total revenue
- Decision: Implement new rate with value-positioning strategy
- For a complete growth plan, check out our guide on how to scale your freelance business to $10K/month
Mistake #10: Relying Solely on Gut Feeling
The Problem: Intuition Without Validation
The final data driven decision making mistake is the most dangerous: making all decisions based on “feel” rather than evidence. While intuition has value, successful freelancers in 2025 combine instinct with data validation. Learn how to enhance that process using automation and machine learning in our guide Mastering AI for Freelancers.
Common Gut-Feeling Traps:
- “This client seems great” (without checking payment history)
- “I should lower my prices” (without analyzing demand)
- “This project will be easy” (without time tracking data)
- “I don’t need that service” (without market research)
The Solution: Validate Intuition With Data-Driven Decisions
Decision-Making Framework for data driven decision making:
- Initial Gut Reaction — What does instinct say?
- Data Collection — What metrics are relevant?
- Analysis — What do the numbers suggest?
- Synthesis — How do intuition and data align?
- Decision — Choose the path with strongest evidence
- Tracking — Monitor results to improve future decisions
Example Application:
- Gut Feeling: “I should specialize in e-commerce projects”
- Data Check: EPH analysis shows e-commerce projects average $85/hour vs. $72/hour for general web design
- Market Research: E-commerce freelancer demand up 34% in 2024
- Decision: Validated — begin e-commerce specialization
- Tracking: Monitor specialization impact on rates and demand
Fixing the Mistakes: Your 30-Day Data Clean-Up Plan
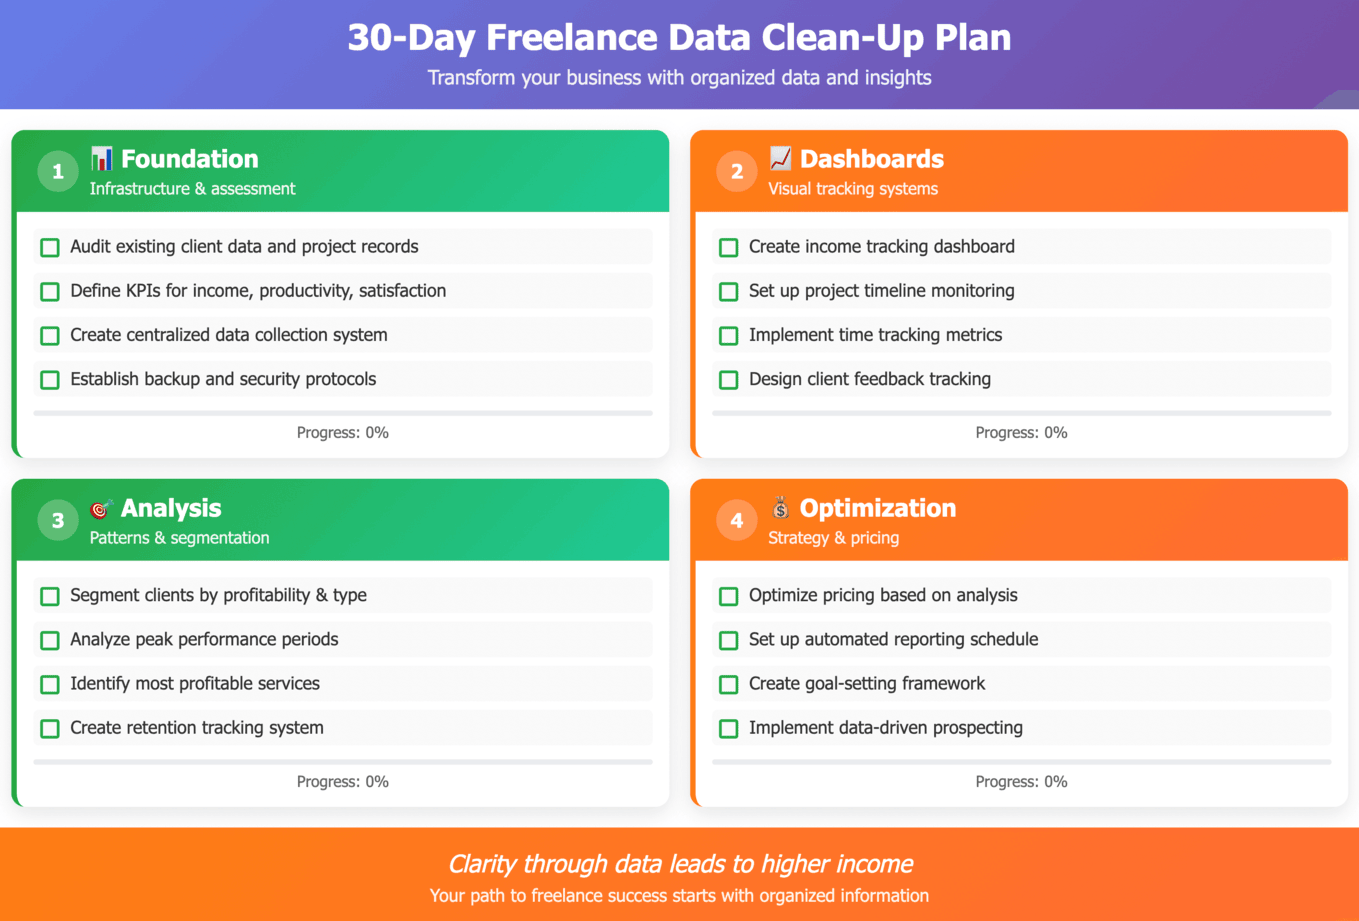
Week 1: Foundation Setup
Day 1-2: KPI Selection
- Choose 5-7 core metrics from our recommendations
- Set up tracking systems (spreadsheet or tool)
- Establish baseline measurements
Day 3-4: Dashboard Creation
- Build simple visual dashboard
- Connect data sources
- Test update procedures
Day 5-7: Historical Data Entry
- Input last 3 months of data
- Identify initial patterns
- Set monthly targets
Week 2: Deep Dive Analysis
Day 8-10: EPH Calculation
- Calculate true EPH for recent projects
- Identify most/least profitable work
- Analyze time allocation patterns
Day 11-12: Client Segmentation
- Categorize clients by size, industry, profitability
- Calculate segment-specific metrics
- Identify highest-value segments
Day 13-14: Conversion Analysis
- Map your sales funnel
- Calculate conversion rates at each stage
- Identify improvement opportunities
Week 3: Visualization and Systems
Day 15-17: Dashboard Enhancement
- Add visual elements to data
- Create client-facing report templates
- Set up automated data collection where possible
- For a full step-by-step guide on creating automation workflows that eliminate manual updates and save hours weekly, read Freelance Data Automation: Set Up Smart Systems That Work for You
Day 18-19: Review Process Implementation
- Schedule weekly and monthly review times
- Create review checklists
- Set up progress tracking systems
Day 20-21: Client Communication
- Design client report format
- Prepare historical performance summaries
- Plan value-demonstration strategy to optimize freelance client retention
Week 4: Optimization and Testing
Day 22-24: Pricing Analysis
- Review current rates vs. EPH data
- Research market rates for your segments
- Design pricing test strategy
Day 25-26: Process Optimization
- Identify inefficiencies from time data
- Streamline low-value activities
- Optimize high-impact processes
Day 27-30: Implementation and Testing
- Launch pricing tests with new prospects
- Begin sharing performance data with existing clients
- Set up ongoing optimization schedule
FAQ: Common Questions About Data Driven Decision Making for Freelancers
Q1: What’s the minimum data I need to track as a new freelancer?
A: Start with just three metrics: Monthly Revenue, Average Project Value, and Time Spent per Project. These give you foundation insights without overwhelming complexity. As you grow, gradually add Client Lifetime Value and Earnings Per Hour.
Q2: How much time should I spend on data analysis each week?
A: Dedicate 30 minutes weekly for basic updates and 90 minutes monthly for deeper analysis to ensure you’re making informed, data-driven decisions consistently. Many freelancers overthink this and spend too much time analyzing instead of acting on insights.
Q3: Should I share my performance data with clients?
A: Yes, but strategically. Failing to share results and value metrics with clients is one of those subtle data driven decision making mistakes that weakens your perceived value. Focus on project outcomes, efficiency improvements, and business impact. This positions you as a strategic partner rather than just a service provider.
Q4: What tools do you recommend for freelance data tracking?
A: Whether you’re a beginner or advanced user, choosing the right tools for data tracking is essential — from simple options like Google Sheets and Notion to advanced platforms like Tableau or Power BI for deeper analysis. Choose based on your technical comfort level and business complexity.
Q5: How do I know if my rates are too low based on data?
A: Calculate your True Earnings Per Hour (including all project-related time) and ensure high data quality when comparing it to your target income requirements for more accurate pricing insights. If your EPH is below your target hourly rate, or if you’re booking 100% of proposals, your rates are likely too low. Test 15-20% increases with new prospects.
↑ Back to Table of ContentsConclusion: Data-Driven Decision-Making Is Your Competitive Edge
The data-driven decision-making mistakes outlined in this guide are quietly draining your income, time, and growth potential. But here’s the truth: freelancers who embrace a data-driven approach to decision making earn 43% more than those who rely solely on gut feeling, according to the MBO State of Independence report.
The top freelancers in 2025 aren’t guessing — they’re tracking, analyzing, and optimizing. They know:
- Which clients are actually profitable through advanced client profitability analysis
- Which services deserve premium pricing based on real data
- And how to scale with confidence and precision using data driven decision making
Your journey to becoming one of them starts not with doing everything, but with fixing just one mistake. Choose the one that’s costing you the most today, implement the solution, and track the difference over the next 30 days.
Ready to master data-driven decision making?
Join thousands of freelancers in our Telegram channel FreelanceBoosters – where we share exclusive tips, templates, systems, and growth tools every week.
Don’t let your data sit unused. Put it to work. Make it profitable. Build your future.
📌 Your online presence is not a static page — it’s a dynamic engine for freelance growth. Make it count. – Tom @ Freelance Pathway